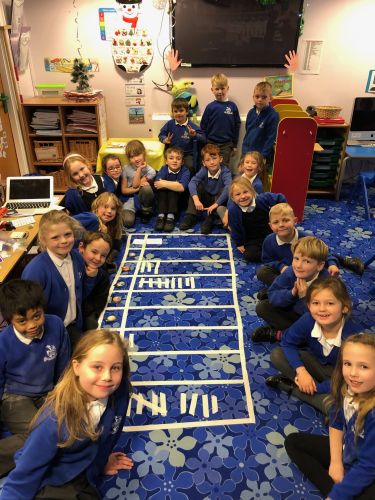
2M have been learning about Statistics in Maths. We have been looking at different ways to display data including tally charts, bar charts and pictograms. The children decided they would like to vote to find out what our favourite planet was. They chose to display this information using a tally chart and then used the information to draw their own bar charts. The children then wrote statements about their findings.
2M Statistics

